Ecologists have, for a long time, been fascinated by the relationship between body size and population density. As John Damuth showed for mammals nearly 4 decades ago, average vertebrate population densities tend to decline with increasing body mass following a power law with a scaling of mass to the -3/4 power. This is particularly intriguing as, for even longer, metabolic demand has been known to increase with mass to the 3/4 power. Thus, the use of energy per unit area by different species should be roughly the same, regardless of the size of those species. In principle, if one replaced a population of elephants in a large area with a population of voles, the voles should account for the same amount of energy as the elephants had done. This is the concept known as energy equivalence. It is appealing, but not without its critics. It is part of the reason why there has been a long fascination with mean relationships between population density and body size.
Something that has been far less studied is the nature of variation around those mean relationships between population density and body size. However, many plots of observed densities against body mass appear to show quite strong relationships between the extremes of density and body mass. As two examples, consider published data on both mammals and birds (Fig. 1). The data for mammals appear to show upper and lower limits that show similar scaling to that of the mean. By contrast, the data for birds suggest that the upper limit is more steeply negative than the mean, whilst the lower limit is almost mass invariant. Both graphs suggest that the smallest species do not reach densities as high as would be expected from the overall scaling of the upper boundaries. The question arises, what determines these upper and lower limits?
Something that has been far less studied is the nature of variation around those mean relationships between population density and body size. However, many plots of observed densities against body mass appear to show quite strong relationships between the extremes of density and body mass. As two examples, consider published data on both mammals and birds (Fig. 1). The data for mammals appear to show upper and lower limits that show similar scaling to that of the mean. By contrast, the data for birds suggest that the upper limit is more steeply negative than the mean, whilst the lower limit is almost mass invariant. Both graphs suggest that the smallest species do not reach densities as high as would be expected from the overall scaling of the upper boundaries. The question arises, what determines these upper and lower limits?
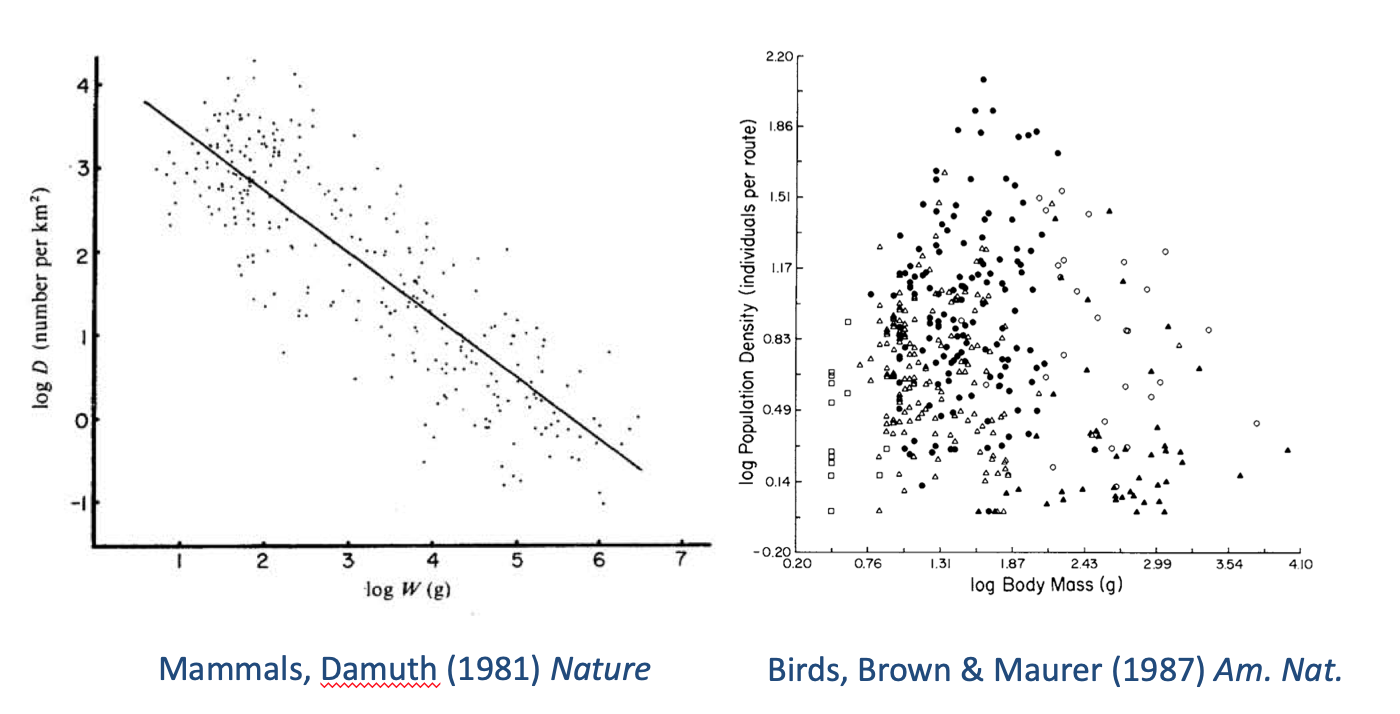
Fig. 1. Published relationships between population densities (or their proxies) and body mass.
There have been a few attempts to estimate the location of the lower bounds empirically. However, there have been few formal attempts to identify where those bounds would be expected to lie. Of the lower bound, Sir John Lawton has written, "we have only the haziest notion how the lower bound ... is determined". Although there is general agreement that the upper bound must be constrained by energy availability, we have not come across a formal prediction of where it should lie. Indeed, the only thought experiment about its location was conducted by Cotgreave and Harvey in the 1990s, when they speculated about how dense a species could become based on how many could be packed into the landscape if each individual were a cube with the specific gravity of water. Neither the slope nor the magnitude of that potential limit appeared to do a good job of explaining the scaling of maximum density (Fig. 2).
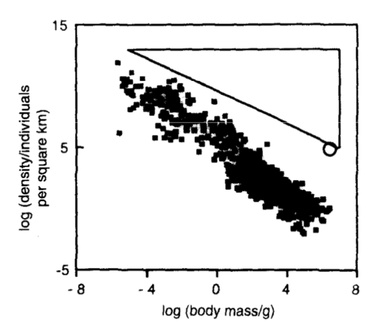
Fig. 2. If every individual were a cube with the specific gravity of water, this figure suggests that we would never observe population densities in the triangle. We don't - but, given the scale on the y-axis, this doesn't seem a satisfactory explanation for the location of the upper limit to population density. (From Cotgreave & Harvey 1993 Trends in Ecology & Evolution)
Prompted by these observations, we decided to identify some simple models that would guide us about where we expected the limits to population density to lie. Specifically, we conjectured that an upper limit to population density might lie where a species accounted for all above-ground net primary productivity (ANPP) in the most productive biomes on earth. With such a varied and coarse diet, assimilation efficiency would be low. Accounting for that, and dividing the density of ANPP by mass-specific individual field metabolic rates identifies that upper bound.
For the lower bound, we conjectured that the area of an individual's home range would increase with the distance they travelled in a day. At the limit to area use, they would be travelling as far as they could each day. If there was no overlap among home ranges but no gaps between them, this would be the limit to individual area use in a spatially-contiguous population. For various reasons, this model assumed that area used would increase in proportion to the square of daily travel distance; we referred to this model as the "targeted search model".
We used published relationships between body mass and key parameters in these models, in order to estimate where the limits to density might lie for both birds and mammals. We compared those predicted limits to estimated population densities for 10,474 populations of birds and mammals and found that, given the simplicity of the models, they did a remarkably good job of describing the empirical extremes of the data (Fig. 3).
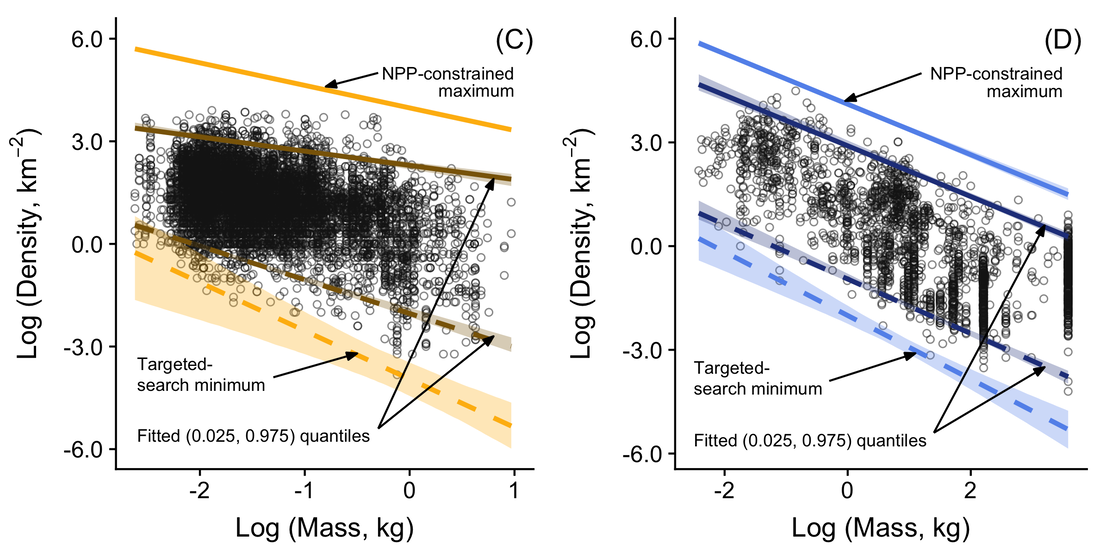
Fig. 3. Empirical estimates of population density for 8,188 bird (left panel) and 2,286 mammal (right panel) populations (open circles), together with fitted quantiles and estimates of where upper (paler solid lines) and lower (paler broken lines) limits should lie.
Clearly, these models are substantial improvements on previous attempts to identify where the limits to population densities should lie. However, they also expose a number of other intriguing phenomena. Intensity of use relates to the distance travelled per unit area of home range, and one intriguing observation is that - unsurprisingly - small species seem to use space more intensively than larger species but that birds use space more intensively than similarly-sized mammals. Despite their higher intensity of use, the greater mobility of birds means that they typically use larger areas than mammals of similar size. This means that they can reach lower densities than mammals. Second, there have been previous suggestions that the range of population densities at which animals of a given size might be found (a measure that we term "population scope") will be narrower as body mass increases. However, we found no suggestion of this in our data. Third, different feeding guilds differ in how closely they approach the expected limits; these differences happen - in some cases - for predictable reasons, whilst, in other cases, they are puzzling. Herbivorous and omnivorous birds, in particular, seem to show much less body mass scaling than carnivorous birds and all trophic guilds of mammals. A fourth observation is that human hunter-gatherer societies seem to conform well to the same patterns of population density variation that are expected of similarly-sized wild mammals - but modern human densities are very much higher - exceeding those of the most abundant rodent populations (Fig. 4)!
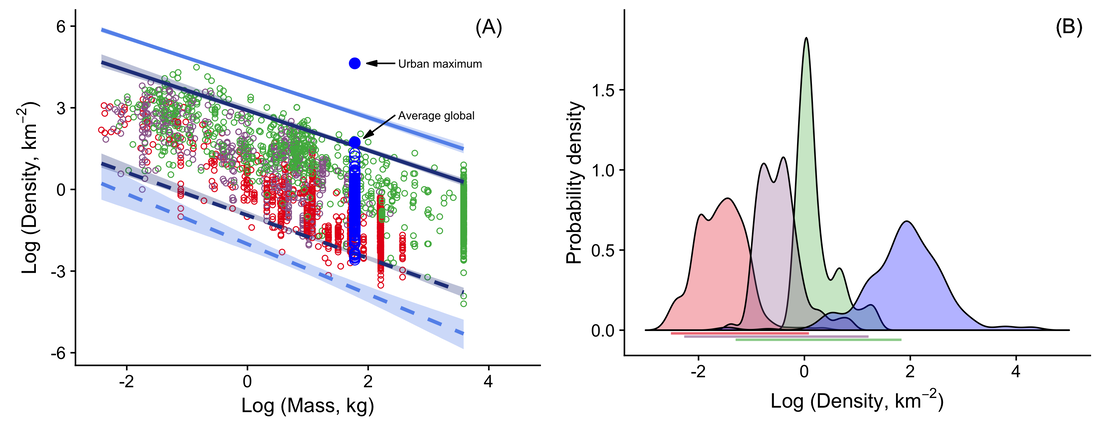
Fig. 4. Left panel: population densities of herbivorous (green), omnivorous (purple) and carnivorous (red) mammals in relation to body mass; open blue circles show human hunter-gatherer populations and filled blue circles are the human densities indicated. Right panel: distributions of hunter-gatherer population densities for societies with relatively carnivorous (red), omnivorous (purple) and herbivorous (green) diets in relation to the quantile spans for the same trophic groups of wild mammals (horizontal lines); the blue distribution shows modern human densities by country.
Overall, our analyses suggest that, within a taxon, animals of a given size can vary in their population densities by around 4 orders of magnitude - i.e., by around 10,000 times! This must have huge implications for rates of interaction between individuals and for their time and energy budgets.
Many refinements of these models are doubtless possible. However, an important challenge will be to identify when failures of a given species group to fill expected ranges of population densities are due to sampling biases and when they are due to morphological, physiological or behavioural constraints. More work is required to identify the underlying parameters with greater confidence, to produce unbiased distributions of abundance estimates, and to validate the assumptions of our underlying expectations about the relationship between travel distance and area use. Nevertheless, these models substantially improve on previous estimates of where the limits to density should lie, and provide useful frames of reference against which to evaluate observed distributions of population densities in these and other taxa.
This post relates to work published in Ecology Letters. Read the original paper for free, here.
 RSS Feed
