Conservation Ecology Group @ Durham University
  • Home
  • People
  • Research
  • Publications
  • Opportunities
  • News
  • Seminars
  • Contact
  • Biological Invasions on South Georgia

New PhD students to start in October 2019

8/3/2019

0 Comments

 
The group will be welcoming a number of new PhD students later this year who have recently been awarded studentships/funding to study here. They will be:

Emily Baker, who will be joining us on an IAPETUS2 studentship.  Emily will be moving from (but still working with) CEH and will be working on a project on “The validation of ecological citizen science data”, also in collaboration with the NBN and APHA. Emily will be supervised by Phil Stephens.

Eilidh Smith, who will be funded by the Whitehead Trust.  Eilidh will be moving from the University of the Highlands and Islands, where she has been working on reindeer in the Cairngorms.  Her focus will be a project on “Impacts of disturbance on red deer”. Eilidh will be supervised by Phil Stephens.

Peter Stewart, who will be funded by a NERC IAPETUS2 studentship. Peter will be moving from Imperial College London, to answer the question "How do invasive species impact African wild mammals?" in Kenya. Peter will be supervsied by Wayne Dawson.

Katy Ivison, who will be funded by a Leverhulme Durham ARCTIC studentship. Katy is a graduate from the University of Birmingham, and will work on a project asking "How will climate change and natural enemies affect non-native plant invasion risk in Arctic Norway?". Katy will be supervsied by Wayne Dawson.

David Jarrett is coming to Durham from the British Trust for Ornithology and is funded by a Leverhulme DurhamArctic scholarship to study for a PhD on  ‘Climate change and Arctic wildlife: consequences for human-wildlife interactions & ecosystem services’.


We look forward to welcoming them to the group!
0 Comments

Body size and the limits to population density

6/2/2019

1 Comment

 
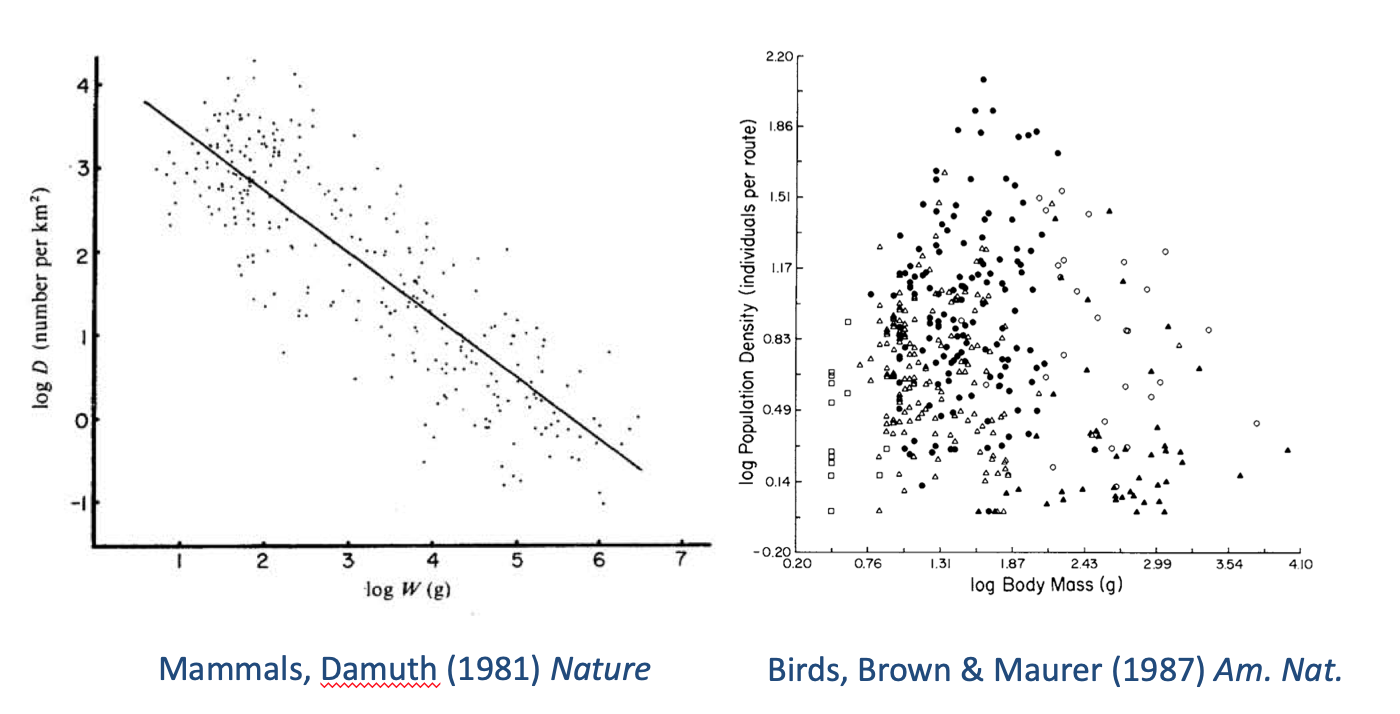
Ecologists have, for a long time, been fascinated by the relationship between body size and population density. As John Damuth showed for mammals nearly 4 decades ago, average vertebrate population densities tend to decline with increasing body mass following a power law with a scaling of mass to the -3/4 power. This is particularly intriguing as, for even longer, metabolic demand has been known to increase with mass to the 3/4 power. Thus, the use of energy per unit area by different species should be roughly the same, regardless of the size of those species. In principle, if one replaced a population of elephants in a large area with a population of voles, the voles should account for the same amount of energy as the elephants had done. This is the concept known as energy equivalence. It is appealing, but not without its critics. It is part of the reason why there has been a long fascination with mean relationships between population density and body size.

Something that has been far less studied is the nature of variation around those mean relationships between population density and body size. However, many plots of observed densities against body mass appear to show quite strong relationships between the extremes of density and body mass. As two examples, consider published data on both mammals and birds (Fig. 1). The data for mammals appear to show upper and lower limits that show similar scaling to that of the mean. By contrast, the data for birds suggest that the upper limit is more steeply negative than the mean, whilst the lower limit is almost mass invariant. Both graphs suggest that the smallest species do not reach densities as high as would be expected from the overall scaling of the upper boundaries. The question arises, what determines these upper and lower limits?
Picture
Fig. 1. Published relationships between population densities (or their proxies) and body mass.
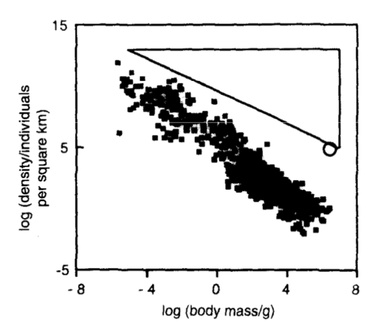
There have been a few attempts to estimate the location of the lower bounds empirically. However, there have been few formal attempts to identify where those bounds would be expected to lie. Of the lower bound, Sir John Lawton has written, "we have only the haziest notion how the lower bound ... is determined". Although there is general agreement that the upper bound must be constrained by energy availability, we have not come across a formal prediction of where it should lie. Indeed, the only thought experiment about its location was conducted by Cotgreave and Harvey in the 1990s, when they speculated about how dense a species could become based on how many could be packed into the landscape if each individual were a cube with the specific gravity of water. Neither the slope nor the magnitude of that potential limit appeared to do a good job of explaining the scaling of maximum density (Fig. 2).
Picture
Fig. 2. If every individual were a cube with the specific gravity of water, this figure suggests that we would never observe population densities in the triangle. We don't - but, given the scale on the y-axis, this doesn't seem a satisfactory explanation for the location of the upper limit to population density. (From Cotgreave & Harvey 1993 Trends in Ecology & Evolution)

Prompted by these observations, we decided to identify some simple models that would guide us about where we expected the limits to population density to lie. Specifically, we conjectured that an upper limit to population density might lie where a species accounted for all above-ground net primary productivity (ANPP) in the most productive biomes on earth. With such a varied and coarse diet, assimilation efficiency would be low. Accounting for that, and dividing the density of ANPP by mass-specific individual field metabolic rates identifies that upper bound.

For the lower bound, we conjectured that the area of an individual's home range would increase with the distance they travelled in a day. At the limit to area use, they would be travelling as far as they could each day. If there was no overlap among home ranges but no gaps between them, this would be the limit to individual area use in a spatially-contiguous population. For various reasons, this model assumed that area used would increase in proportion to the square of daily travel distance; we referred to this model as the "targeted search model".

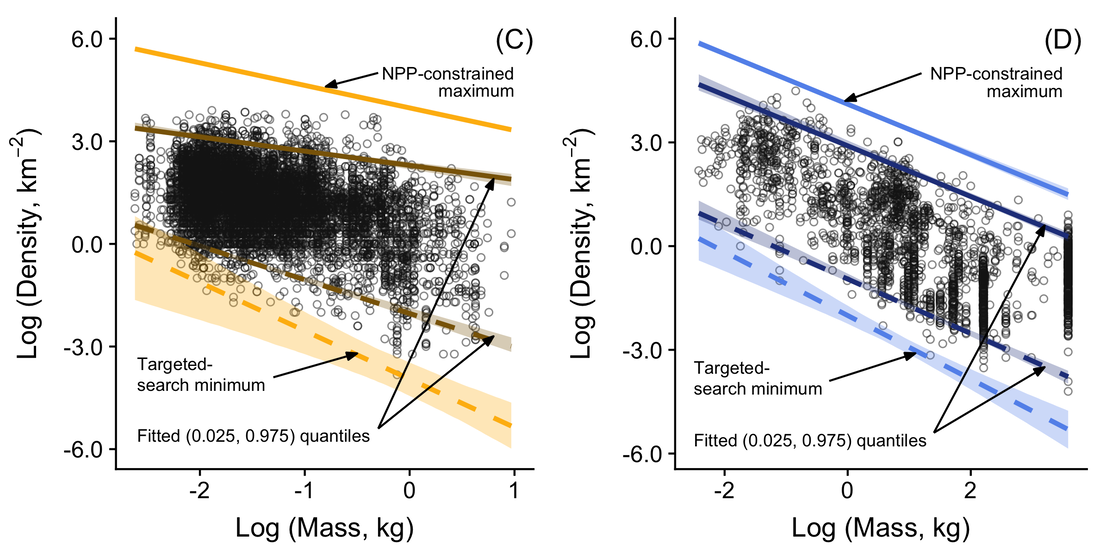
We used published relationships between body mass and key parameters in these models, in order to estimate where the limits to density might lie for both birds and mammals. We compared those predicted limits to estimated population densities for 10,474 populations of birds and mammals and found that, given the simplicity of the models, they did a remarkably good job of describing the empirical extremes of the data (Fig. 3).
Picture
Fig. 3. Empirical estimates of population density for 8,188 bird (left panel) and 2,286 mammal (right panel) populations (open circles), together with fitted quantiles and estimates of where upper (paler solid lines) and lower (paler broken lines) limits should lie. 
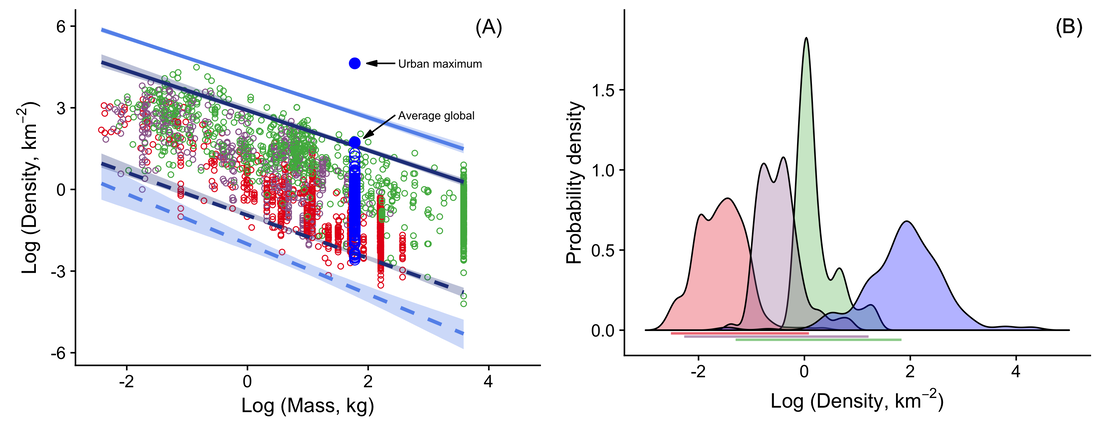
Clearly, these models are substantial improvements on previous attempts to identify where the limits to population densities should lie. However, they also expose a number of other intriguing phenomena. Intensity of use relates to the distance travelled per unit area of home range, and one intriguing observation is that - unsurprisingly - small species seem to use space more intensively than larger species but that birds use space more intensively than similarly-sized mammals. Despite their higher intensity of use, the greater mobility of birds means that they typically use larger areas than mammals of similar size. This means that they can reach lower densities than mammals. Second, there have been previous suggestions that the range of population densities at which animals of a given size might be found (a measure that we term "population scope") will be narrower as body mass increases. However, we found no suggestion of this in our data. Third, different feeding guilds differ in how closely they approach the expected limits; these differences happen - in some cases - for predictable reasons, whilst, in other cases, they are puzzling. Herbivorous and omnivorous birds, in particular, seem to show much less body mass scaling than carnivorous birds and all trophic guilds of mammals. A fourth observation is that human hunter-gatherer societies seem to conform well to the same patterns of population density variation that are expected of similarly-sized wild mammals - but modern human densities are very much higher - exceeding those of the most abundant rodent populations (Fig. 4)!
Picture
Fig. 4. Left panel: population densities of herbivorous (green), omnivorous (purple) and carnivorous (red) mammals in relation to body mass; open blue circles show human hunter-gatherer populations and filled blue circles are the human densities indicated. Right panel: distributions of hunter-gatherer population densities for societies with relatively carnivorous (red), omnivorous (purple) and herbivorous (green) diets in relation to the quantile spans for the same trophic groups of wild mammals (horizontal lines); the blue distribution shows modern human densities by country.
Overall, our analyses suggest that, within a taxon, animals of a given size can vary in their population densities by around 4 orders of magnitude - i.e., by around 10,000 times! This must have huge implications for rates of interaction between individuals and for their time and energy budgets.

​Many refinements of these models are doubtless possible. However, an important challenge will be to identify when failures of a given species group to fill expected ranges of population densities are due to sampling biases and when they are due to morphological, physiological or behavioural constraints. ​More work is required to identify the underlying parameters with greater confidence, to produce unbiased distributions of abundance estimates, and to validate the assumptions of our underlying expectations about the relationship between travel distance and area use. Nevertheless, these models substantially improve on previous estimates of where the limits to density should lie, and provide useful frames of reference against which to evaluate observed distributions of population densities in these and other taxa.

This post relates to work published in Ecology Letters. Read the original paper for free, here.
1 Comment

Diet, luck and population dynamics

20/12/2018

0 Comments

 
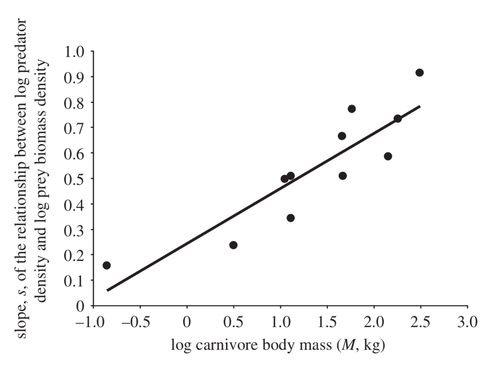
In 2011, together with collaborators at London's Institute of Zoology, Phil published a paper showing that the abundance of small carnivores seemed to be less affected by food availability than that of large carnivores. Specifically, when looking across systems at the relationship between carnivore numbers and the biomass of their food, there was a strong effect of carnivore body mass on that relationship: for a given proportional change in food availability, the largest carnivores showed a change in abundance about 5 times larger than the change experienced by the smallest carnivores. Intriguingly, the slope of those relationships seemed very strongly determined by the predators' body masses (see Figure 1).
Picture
Figure 1. The slope of the predator abundance - prey biomass relationship seems strongly determined by logged predator biomass (with a slope of 0.22) (from Carbone et al. 2011).

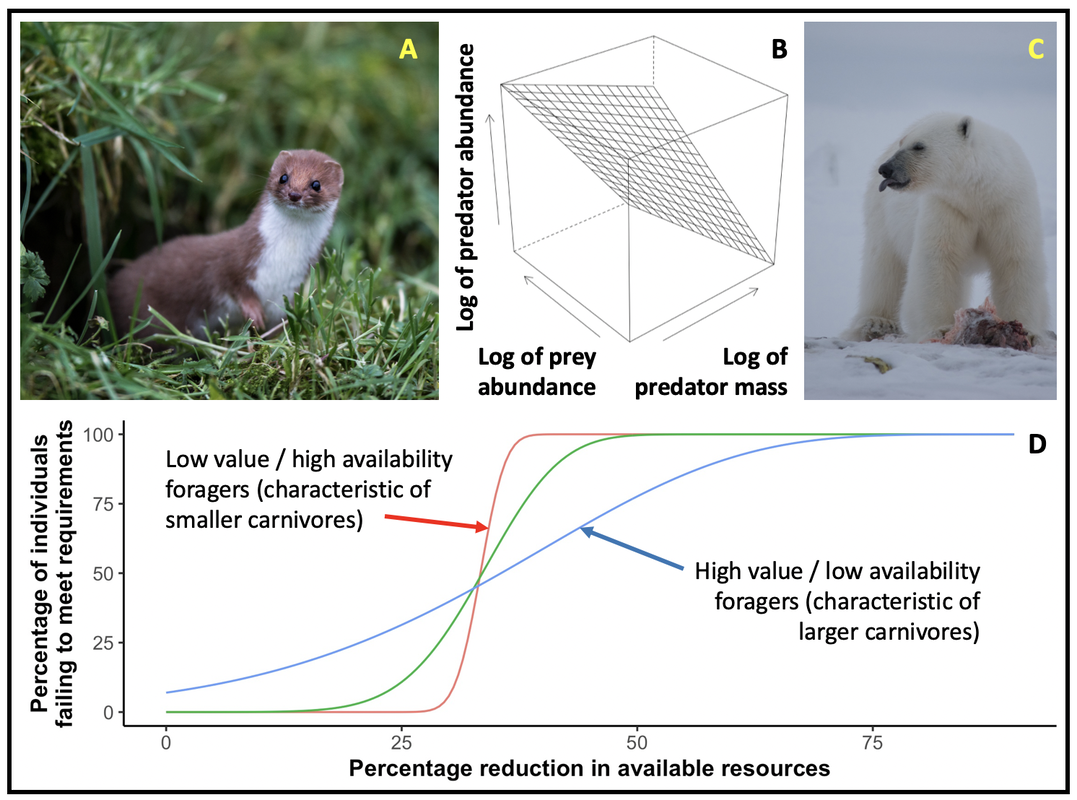
This finding vexed us because, although we could think of a variety of possible explanations, we couldn't find empirical or theoretical support for any of them. A new paper by Rory Wilson and colleagues presents a possible explanation. Specifically, for a variety of animals with different diets, they present empirical data on the time taken to find and ingest food items. Perhaps unsurprisingly, they find that foragers focusing on low value but highly abundant food (such as grazers eating grass), the time taken to find and ingest food is low and, as a result, the variation in that time between different individuals is also low. By contrast, when foragers focus on high value but low availability foods (like large carnivores preying on large herbivores), the time taken to find and ingest food can be very high; moreover, the variance in time taken by different individuals - simply as a consequence of luck in finding food - can be huge. As Wilson & co. show, this can have very important implications for population dynamics. This is because, as long as food is suitably abundant, low value / high availability foragers will all acquire enough energy to survive and reproduce (and there will be limited variation between individuals in their capacity to do so). However, for high value / low availability foragers, there will be high variation between individuals; simply by chance, many individuals may fail to acquire sufficient energy to survive and reproduce.

In an overview of the importance of Wilson et al.'s new paper, now published in the journal Current Biology, Phil argues that it could influence our thinking about a wide variety of phenomena in ecology and behaviour. These range from the role of diet and luck in determining the evolution of lactation and capital breeding, to food-sharing and alloparenting (with profound implications for the origins of sociality). Importantly, as a result of the link between diet and body size, the modulating effect of body size on luck and population dynamics might thus be expected to explain the strong influence of carnivore body size on the strength of the relationship between food availability and carnivore abundance (see Figure 2).
Picture
Figure 2. Data on terrestrial mammalian carnivores from the least weasel (A) to the polar bear (C) were collated by Carbone et al. A linear model (B) showed that the abundances of the largest carnivores were strongly affected by the abundances of their prey, whilst those of smaller carnivores were relatively weakly influenced by prey availability. Starting from an environment with ample resources, successive reductions in prey availability lead to a rapid increase in the proportion of a population failing to gain the energy required to survive and breed when that population utilises rare, high quality prey (panel D, blue line). For populations reliant on low quality but frequently-encountered prey (panel D, red line), reductions in prey availability initially have little effect but, eventually, the habitat rapidly becomes completely inviable. For populations utilising prey of intermediate value and frequency of encounter (panel D, green line), the situation is intermediate between these extremes. Thus, assuming that data on predator and prey abundances come from areas in which the predator population is viable (i.e., the left hand side of the graph in panel D), the role of luck highlighted by Wilson et al. suggests why small predators (feeding on small but relatively common prey) might show much less impact of prey declines than do large predators (feeding on large but relatively uncommon prey). The results shown in (D) are for predators that need to acquire 100 units of energy per day, and feed on prey of value 10, 1 and 0.1 units of energy with per-second probabilities of encounter (in the environment before prey reductions) of 0.000174, 0.00174 and 0.0174, respectively. They are computed as cumulative daily probabilities of obtaining any amount of energy below the required amount, using the pbinom() function in R. [Photo (A) by Ashley Buttle, photo (C) by Orion Wiseman; both images released under a CC BY 2.0 license.]

With further information on the search times of a wider range of species, it might become possible to establish the body-mass scaling of these phenomena. Integrating them with other allometric relations, such as time to starvation, will enable broader, macroecological predictions regarding their implications. It might also be possible to identify sources of autocorrelation in the measured search times of specific individuals, and to identify how much of inter-individual variation is due to luck and how much is due to variation in competence. There is a need to consider the role of handling time which, itself, will induce negative correlations between luck and time available for foraging. These considerations all highlight that further consideration of the inter-related roles of diet and luck could be an active and productive field, which could yield important further insights for a range of disciplines within population and evolutionary ecology.
0 Comments

Why do some areas have more threatened species than others?

14/12/2018

0 Comments

 
​To protect biodiversity effectively, we need to identify where to focus conservation actions and what those actions should be. This requires an understanding of the distribution and drivers of threatened species richness. We have a fairly good idea of where threatened species currently occur, but we don’t necessarily know why some areas are home to larger numbers of threatened species than others.  Are these areas subject to the pressures of extensive human activities? Or, conversely, might they be providing refuges for species away from human activities? Are the species present in an area more prone to extinction than species elsewhere? Or is it purely a question of numbers; do areas with large numbers of threatened species simply have more species overall?
​
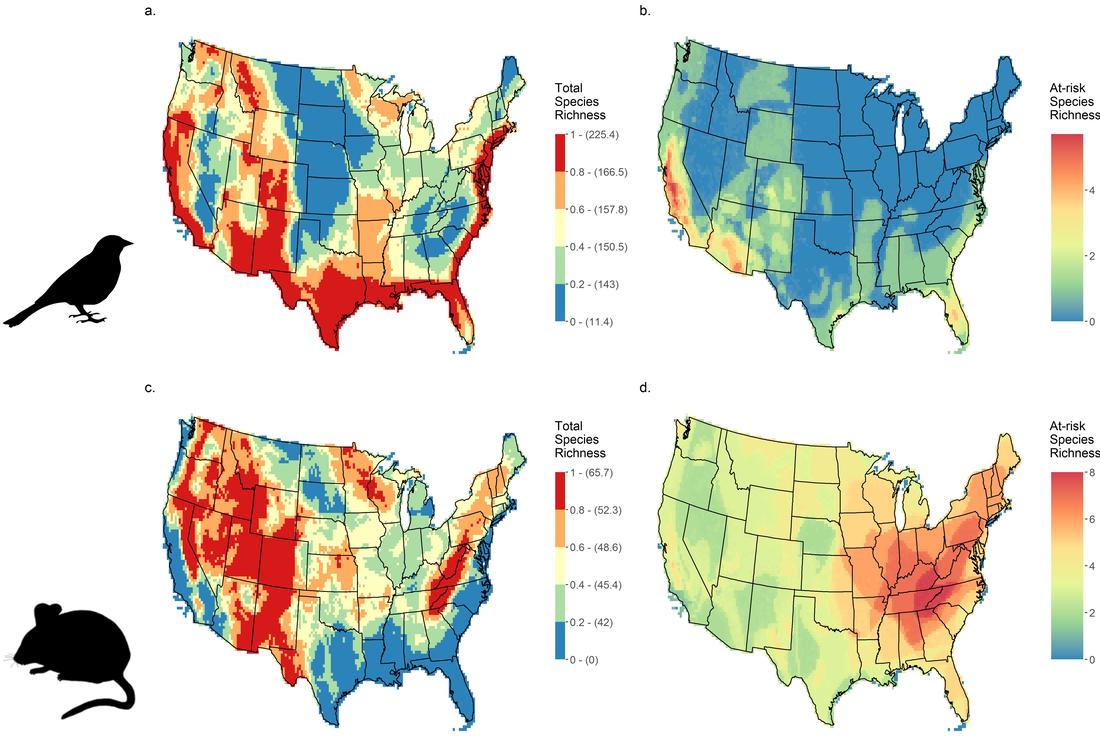
Our new paper in Conservation Letter addresses these questions, identifying the features of an area that influence how many threatened species occur there.  To do this, we collaborated with Curt Flather from the USDA Forest service to examine the distribution of threatened birds and mammals across the contiguous United States (Fig.1). We found that environmental factors, such as temperature and precipitation, are of far greater importance in determining threatened species richness than either the effects of human activities or the biological characteristics of the species present (e.g. their body mass, life span etc.).
Picture
Fig 1: The distribution of total and threatened bird and mammal species richness across the contiguous United States. Notice that areas with more threatened species are not always the same places that you find high overall species richness.
​

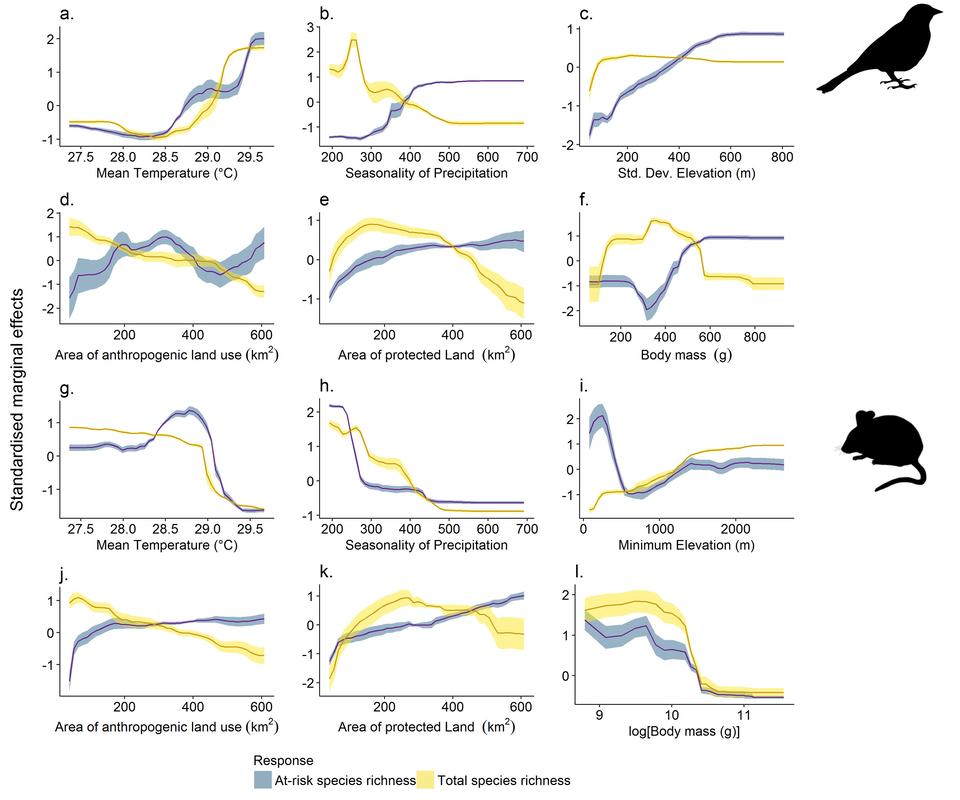
​Significantly, we found that the effects of a number of variables on the richness of threatened species differed substantially from their effects on species richness as a whole (Fig. 2). For example, we found that whilst the number of threatened birds and mammals increases with the amount of land dedicated to anthropogenic activities (i.e. agriculture, urban development), the total number of species decreases. 
Picture

​Figure 2: The effects of different environmental and anthropogenic factors on the total number (yellow lines) and number of threatened (blue lines) bird (panels a-f) and mammal (panels g-l) species.
By identifying the factors that drive the distribution of threatened species, we are better able to establish the costs and benefits of different conservation actions. So for example, we now have a better understanding of where new protected areas should be established in order to maximise their benefits for nature conservation. Our findings can also yield recommendations for the management of existing protected lands. In particular, some protected areas in the US operate under multiple-use mandates, allowing for timber harvesting, livestock grazing and mining. We can use our results to identify how much of an area needs to be dedicated to the protection of at-risk species, and how much could contribute to the provisioning of ecosystem services.

​Finally, and importantly, the results of our study can be used to help the USDA forest service with their scenario planning. By pairing these results with information on possible environmental change, we can now identify where threatened species may occur in future. This information can then feed into conservation planning to ensure that planned interventions are future-proof, maximising the benefits for nature conservation. 
0 Comments
<<Previous

    Archives

    March 2019
    February 2019
    December 2018
    July 2018
    May 2018
    April 2018
    March 2018
    February 2018
    January 2018
    June 2017
    April 2017
    December 2016
    April 2016
    February 2016
    January 2016
    November 2015
    July 2015
    June 2015
    May 2015
    April 2015
    March 2015
    October 2014
    September 2014
    August 2014
    July 2014
    June 2014
    May 2014
    April 2014
    March 2014
    February 2014
    January 2014
    October 2013

    Categories

    All
    Durham's Wildlife
    Fieldwork
    Group Members
    Other
    Publications
    Research
    Stu's Top Moths
    Techniques & Methods
    Undergraduates
    Volunteers

    RSS Feed

Powered by Create your own unique website with customizable templates.